Just Another ARTS2090 Blog

Publics and Publishing in Transition

Tag: Arts2090

Add, Consume and Redirect

In today’s highly digitised society, we are inundated by masses of information which can easily be accessed at the tip of our fingers with the Internet. This is also known as a world of flow, whereby we live in a world where information is everywhere (Guilhard 2010). Sociologist Danah Boyd, states that this concept of the world of flow “suggests that you’re living in the stream: adding to it, consuming it, redirecting it.” This means that we are no longer just passive consumers of media, taking in the information fed to us via print and broadcast media. Today, we can actively engage with the media content, the online landscape enables us to leave feedback in the form of comments. Additionally, the emergence of new media platforms such as YouTube allow us to not only watch videos, but also provides an environment for us to create and share our own videos with the rest of the world.

In her presentation, Boyd specifically draws our attention to social networking site, Twitter- “Those who are most enamoured with services like Twitter take passionately about feeling as tough they are living and breathing with the world around them, peripherally aware and in tune, adding content to the stream and grabbing from it when it is appropriate…”(Guilhard 2010)- exemplifying how a media platform, in this instance Twitter, allows users to add content in the form of ‘tweets’, consume content via their Twitter feed, and redirect content by ‘re-tweeting’.

References

Guilhard, H. (2010), ‘What is Implied by Living in a World of Flow?’, Truthout, <http://www.truthout.org/what-implied-living-a-world-flow56203>.
How Does It All Weigh Up?

The way information is presented is almost as crucial as the information itself.

The second assessment required us to deliver a five minute presentation to our tutorial class regarding the visualisation we had created. The aim of the project was to make an invisible process visible through a data visualisation.

Rachel and I developed a visualisation to explain the interrelationship between energy intake and energy expenditure, an internal, and thus, invisible process. Although, we have the methods of measuring this process, the data generated is often difficult to interpret and implicate in everyday life. Generally, we cannot perceive the visual effects of this process until the equilibrium is lost between energy input and output (i.e. negative energy balance  = weight loss, positive energy balance = weight gain).

To collate the data for our visualisation we used the Adidas MiCoach system, which includes a heart rate monitor, speed sensor and pace bundle, to measure the immediate physiological responses of a 20-year-old female during four different exercise classes.
The data visualisation would be of interest to a health and lifestyle public, however,  its core is relevant to all human beings as it addresses a natural and fundamental bodily process.

Making the invisible, visible.

The term information graphic or infographic refers to visual representations of data and information. The purpose of these graphics is to communicate large amounts of complex information effortlessly in an easy to read diagram (Newsom & Haynes 2004)

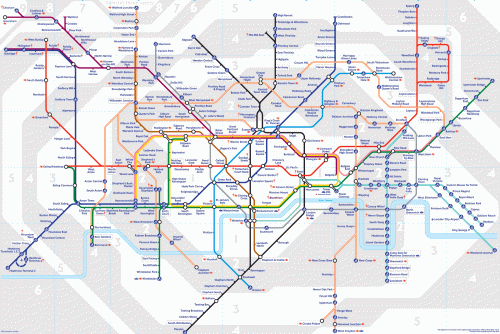
For example, the London Underground Map has the ability to rapidly convey accurate information to the traveller. The use of colour is particularly important, as a commuter is able to instantly identify where they are or where they need to be. Additionally, commuters are able to see whether the station on one line is within walking distance of the station on another line. This information would be very difficult to communicate without this data visualisation.

The London Underground Map

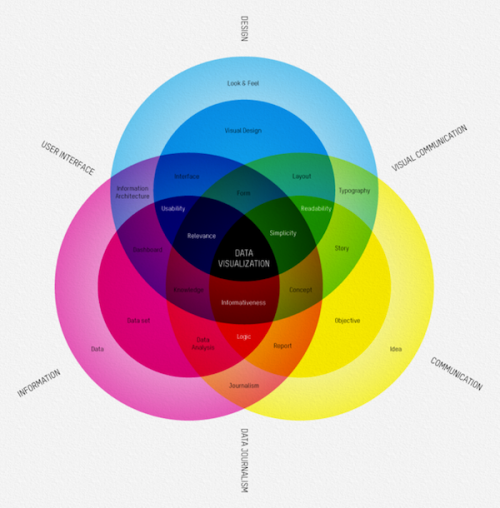
This next infographic seeks to explain the concept of a data visualisation.  The graphic uses a broad spectrum of colours that represent the combination of disciplines with elements and processes, arriving at the conclusion that data visualization is a combination of form, concept and knowledge.

Source: http://blog.ffctn.com/what-is-data-visualization 

Reference

Newsom, D. and Haynes, J. (2004). Public Relations Writing: Form and Style. p.236.

Death by Information Overload

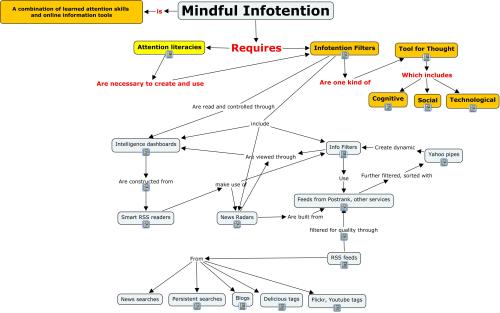
Howard Rheingold  devised the term ‘Infotention’ “to describe the psycho-social-techno skill/tools we all need to find our way online today, a mind-machine combination of brain-powered attention skills with computer-powered information filters.”

In today’s fast-paced, technologically-driven world, we are constantly being bombarded with an influx of information. As a result, we need to be alert for information specifically and immediately useful to us. Infotention is not just about blocking out irrelevant information, it is also about recognising what to let in, how to locate it and how to organise it to come to you when it is updated, and how to filter it.

There is no doubt that most of us struggle with information overload, particularly when it comes to effectively filtering and prioritising the content relevant to our personal and professional life. As a result, the pressures brought about by the emergence and development of the Internet have led to the introduction of new ways to source, organise and filter information.

One of my favourite tools for combating information overload is online bookmarking site Diigo


Last year, a study from Columbia University highlighted that the omnipresence of the Internet, in particular our ability to easily retrieve information from search engines such as Google, had adverse cognitive ramifications. Our increasing dependence on data being available at the blink of an eye has impacted on our ability to retain information and made us less likely to remember information that we can find online.


Furthermore, a recent study from Harvard researchers has concluded that the Internet has taken over as our primary source of memory instead of our own brains. When we want to find out something, we use the Internet as an ‘external memory’ just as computers use an external hard drive.


This does not mean that we are using search engines to think for us, but more so, that we are adapting to the demands of the continuous flow of information and becoming better at recalling how to locate information rather than remember the information itself.


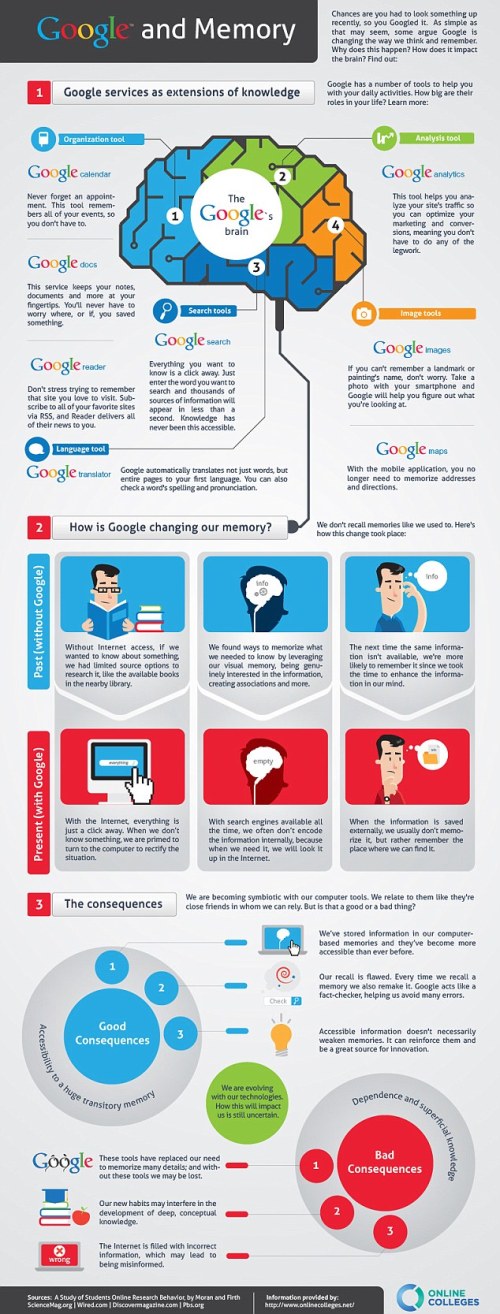
The picture below depicts our “Google brain” and delves further into the cognitive consequences of having such instantaneous access to information:


REFERENCES


Rheingold, Howard (2009) ‘Mindful Infotention: Dashboards, Radars, Filters’, SFGate,<http://www.sfgate.com/cgi-bin/blogs/rheingold/detail?entry_id=46677>.


Sparrow, B., Liu, J. and Wegner, D.M. (2011), “Google Effects on Memory: Cognitive Consequences of Having Information at Our Fingertips”, Science, <http://dx.doi.org/10.1126/science.1207745>.


Waugh, R (2012), ‘Google boggling our brains? Study says humans use Internet as their main ‘memory”, Daily Mail, 25 January, <http://www.dailymail.co.uk/sciencetech/article-2091127/Google-boggling-brains-Study-says-humans-use-internet-main-memory.html#ixzz1sMnTwXKW>.

Facebook Gives Me [Archive] Fever

If Facebook were a country, it would be the 3rd most populated country worldwide. The ubiquitous social networking site is the virtual home to over 800 million active users across the globe.

Before introducing you to the concept of “archive fever”, it is crucial to understand what an “archive” is. An archive is any method of storing and organising data and information so that it can be accessed at a later date.

‘Archive fever’, a term coined by French theorist Jacques Derrida, refers to our ‘repetitive, and nostalgic desire for the archive, an irrepressible desire to return to the origin, a homesickness, a nostalgia for the return to the most archaic place of absolute commencement’ (Derrida 1996, pg. 91).

Based on Derrida’s definition of  “archive fever”, I believe he is referring to the human desire to create a collection of memories (archives), which are a permanent record that document each and every experience in our lives, so that we can easily remember and reminisce.

I believe the rapid development of the digital world, particularly social media, has prompted an epidemic of archive fever.

“By providing us with new ways to share what we’re doing right now, the real-time web also captures something we might not have created otherwise: a permanent record of the event.” (Ogle 2010)

Let’s take a look at Facebook timeline…

As the name suggests, the new profile page design compiles a timeline of your entire life, showcasing information about yourself and your friends on a single page that can be scrolled back years or months at a time, meaning  anyone can catch a glimpse into your social networking past all the way back to the day you joined Facebook. As soon as an photo, status or event is posted on Facebook, it is immediately archived. This opens up the information stored on Facebook to users, enabling data to be even more easily accessed.

Not only has Facebook created an environment for us to connect with others, but with the introduction of Facebook Timeline, it has enabled us to connect with ourselves.

Derrida (1996) explains that while the archive seems to focus on the past, it “should call into question the coming of the future.” He states, “it is a question of the future, the question of the future itself, the question of a response, of a promise and of a responsibility for tomorrow. The archive: if we want to know what that will have meant, we will only know in times to come” (p. 36).

References

Derrida, Jacques (1996) Archive Fever: A Freudian Impression Chicago:University of Chicago Press

Enszer, Julie R. (2008) Julie R. Enszer (personal blog), ‘Archive Fever: A Freudian Impression by Jacques Derrida’, November 16, <http://julierenszer.blogspot.com/2008/11/archive-fever-freudian-impression-by.html>

Ogle, Matthew (2010) ‘Archive Fever: A love letter to the post real-time web’, mattogle.com, December 16, <http://mattogle.com/archivefever/>

Assembling Assemblages

The future of the publishing world is uncertain as the industry is continuously undergoing rapid change brought about by the emergence of advanced digital technology and e-readers.

There are a number of theories and methods that assist us in analysing and rationalising the dramatic shifts in publishing, media and the social.

Just when I thought the notion of publishing was straight-forward, it got a thousand times more complicated…

In this week’s lecture we delved deeper in the world of publishing using the actor-network theory (ANT) as a method to explore publishing’s connection to broader society as a series of interwoven “assemblages” (a term coined by philosophers Gilles Deleuze, Félix Guattari and Manuel DeLanda).

Put simply, an assemblage is a network of human and/or non-human elements or relations.

The ANT was undoubtedly something I found relatively complex and difficult to grasp. Thankfully, I stumbled across this very concise explanation of the ANT (a must-see for anyone who is having trouble comprehending the essence of the theory)

The Evolution of Publishing


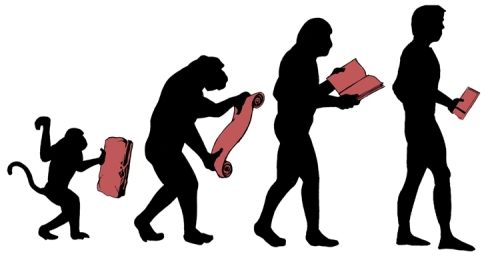
Will e-readers and tablets make printed books obsolete?

Image

Image via <http://blog.sherweb.com/e-books-vs-books-how-the-e-reader-measures-up-to-traditional-print-media/&gt;.

As e-readers and tablets continue to grow in popularity, many of us are beginning to question the future of the printed word.

These new technological devices are changing the way books are read, sold and published.

On one hand, we have individuals like Tim Bajarin, President and Principal Analyst of Creative Strategies, who believe that “it is only a matter of time before we stop killing trees and all publications become digital.”

On the other hand, we have analysts such as Allen Weiner, who believe that although the shift to digital publishing will undoubtedly force publishers to think differently, it will not “spell the demise of print (book) publishing.”

Now, I am certainly no expert on publishing, but I don’t believe that e-readers and tablets will take the place of printed books. There is something about a paper book that cannot be replaced.

No matter how portable e-readers may be, I much prefer reading off a printed book rather than a screen. I’m not sure if it’s the weight of the book in my hand or being able to physically turn the pages of a printed book, or perhaps it is the satisfaction I feel when I can visually see how much of the book I have actually read. Whatever the reason, there are just some things a digital publication can never have that a printed book always will.

There is no doubt that when it comes down to portability and practicality (particularly for frequent travellers- whether it be a long-haul flight or peak-hour transport), e-readers give a whole new definition to the phrase ‘travelling light’.

I recently returned from a vacation in Europe and believe me packing light is definitely not one of my strong suits. Whilst I was over there, I purchased a number of fashion books and magazines from different countries (evidently, the 32kg luggage restriction had completely slipped my mind). Hence, this highlights that e-readers and tablets not only save you the hassle of having to exhaustively lug around extremely heavy luggage, but also rescue you from the exorbitant excess baggage costs.

I don’t know about you, but I certainly won’t be trading my beloved printed publications for e-books anytime soon, however, I will most definitely consider investing in an e-reader or tablet before my next holiday, merely for the sake of convenience.

References

Image via <http://blog.sherweb.com/e-books-vs-books-how-the-e-reader-measures-up-to-traditional-print-media/&gt;.

National Public Radio (2010) ‘E-Book Boom Changes Book Selling And Publishing’, December 21, <http://www.npr.org/2010/12/21/132235154/e-book-boom-changes-book-selling-and-publishing>.

Chapman, Glenn (2011) ‘Tablets, e-readers closing book on ink-and-paper era’, Agence France-Presse, October 29, <http://www.abs-cbnnews.com/lifestyle/gadgets-and-tech/12/29/11/tablets-e-readers-closing-book-ink-and-paper-era&gt;.